相關分析用於測量兩個變數之間的線性關聯程度,變數必須是計量而非類別型態。這個方法是由皮爾森發明,因此也稱為皮爾森相關係數(Pearson correlation coefficient),通常以英文的小寫r來表示。相關係數的值介於-1與1之間,1表示兩個變數線性正相關,-1表示兩個變數線性負相關。
樣本相關係數的公式為:\[r{_x}{_y}=\frac{\displaystyle\sum_{i=1}^{n}(x{_i}-\overline{x})(y{_i}-\overline{y})}{\sqrt{\displaystyle\sum_{i=1}^{n}(x{_i}-\overline{x})^2}\sqrt{\displaystyle\sum_{i=1}^{n}(y{_i}-\overline{y})^2}}\]
\(n\)=樣本數。
\(x{_i}\), \(y{_i}\)=樣本點。
\(\overline{x}\)=樣本平均數,公式=\(\frac{1}{n}\displaystyle\sum_{i=1}^{n}x{_i}\)。
相關係數
相關係數適用於兩個變數都是計量變數的情況。我們以巧克力銷售與諾貝爾獎,來說明相關係數的應用。
新英格蘭醫學期刊(The New England Journal of Medicine)是世界權威的醫學期刊之一。2012年雜誌刊登了一篇名為Chocolate Consumption, Cognitive Function, and Nobel Laureates的文章,作者Franz H. Messerli發現巧克力消費量越高的國家,諾貝爾獎得主也越多,兩者的相關係數高達0.791,p值<.0001。
當年作者從wikipedia的List of contires by Nobel laureates per capita以及Chocosuisse、Theobroma-cacao獲得各國諾貝爾獎人數與巧克力消費數據進行分析。現在我們也如法炮製,看看經過這麼多年以後,巧克力消費是否與諾貝爾獎有關。
相關資料已經從相同網站,依據可獲得資料的程度,更新至2017年、2019年或2020年最新數據,可以從chocolate_nobel下載。
     > chocolate_nobel<-read.csv("c:/Users/USER/downloads/chocolate_nobel.csv", header=T, sep=",")

     > cor(chocolate_nobel[,2], chocolate_nobel[,3])

     [1] 0.6406726
cor()計算相關係數為0.641。雖然不像2012年發表的數據0.791那麼高,但兩者依然呈現正相關。
相關分析
接著我們利用cor.test()作相關分析:
     > cor.test(chocolate_nobel[,2], chocolate_nobel[,3])


             Pearson's product-moment correlation


     data:  chocolate_nobel[, 2] and chocolate_nobel[, 3]
     t = 4.4934, df = 29, p-value = 0.0001034
     alternative hypothesis: true correlation is not equal to 0
     95 percent confidence interval:
      0.3704249 0.8109207
     sample estimates:
           cor
     0.6406726
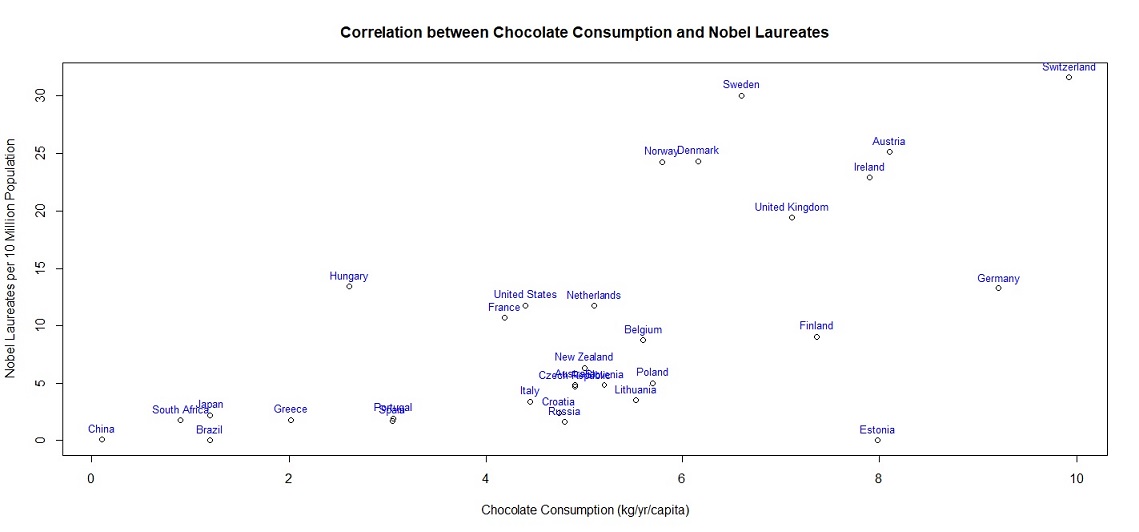
分析結果發現p值.0001034已經沒有<.0001,但仍然非常接近,且一樣達到統計顯著。繪製兩者的散佈圖如下:
     > attach(chocolate_nobel)

     > plot(chocolate_nobel[,2], chocolate_nobel[,3], main="Correlation between Chocolate Consumption and Nobel Laureates", xlab="Chocolate Consumption (kg/yr/capita)", ylab="Nobel Laureates per 10 Million Population")

     > text(chocolate_nobel[,2], chocolate_nobel[,3], labels=Country, cex=0.8, pos=3, col="blue")

無論是2012年的數據,還是目前的數據,都顯示巧克力消費與諾貝爾獎的關聯。但相關分析探究的是兩個變數「統計上的關聯性」,並非兩者的因果關係。很多案例並沒有因果關係,只是在數學上顯示兩者相關而已。

