圓餅圖是常見的統計圖之一,用途是顯示各類別的百分比,有著與直條圖相似的用途。由於人在視覺上對高低的敏感度大於角度與弧度,所以有人主張應該盡量以長條圖取代圓餅圖。儘管如此,圓餅圖仍然是廣泛使用的一種統計圖表。
圓餅圖
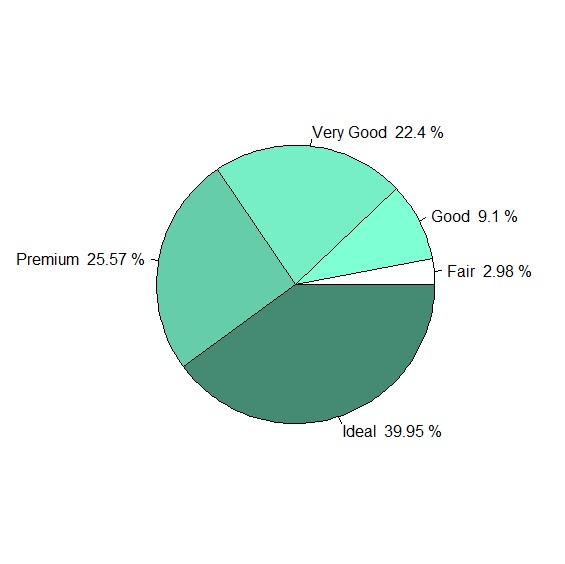
pie()是R Base繪製圓餅圖的指令,pie()可以很快速產出圓餅圖,最大的挑戰不是圓餅圖本身,而是如何製造含有百分比的圖例。我們以ggplot2現成的鑽石diamonds資料檔作為範例,示範如何在R畫出圓餅圖。
首先要先用table()計算鑽石切工cut的次數分配與百分比,用round()四捨五入取到小數第二位。接著再用paste()製作圖例後將圖例指定給pie()就大功告成。
     > library(ggplot2)

     > data(diamonds)

     > attach(diamonds)

     > level<-names(table(cut))

     > count<-as.integer(table(cut))

     > percent<-round(count/sum(count)*100,2)

     > legend<-paste(level,"",percent,"%")

     > pie(table(cut), labels=legend, col=c("white","aquamarine1","aquamarine2","aquamarine3", "aquamarine4"))
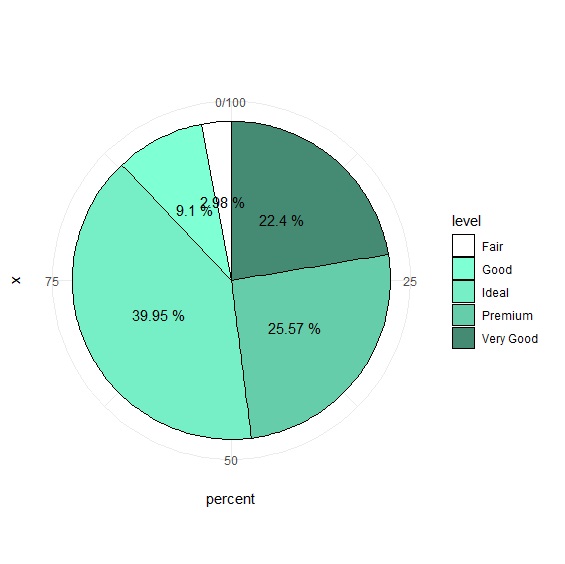
弔詭的是ggplot2沒有geom_pie()的指令,無法直接產出圓餅圖。ggplot2要畫出圓餅圖使用的技巧是先劃出長條圖,再用coord_polar()把長條圖轉換為極座標達到圓餅圖的效果。不過在此之前一樣要先費一番功夫計算百分比,最後再用geom_text()加上圖例。
     > data<-data.frame(level, count, percent)+

     > p<-ggplot(data, aes(x="", y=percent, fill=level))+

     + geom_bar(stat="identity", width=1, color="black")+

     + coord_polar("y", start=0)+

     + scale_fill_manual(values=c("white","aquamarine1","aquamarine2","aquamarine3", "aquamarine4"))+

     + geom_text(aes(label=paste(percent, "%")), position=position_stack(vjust= 0.5))+

     + theme_minimal()

     > p
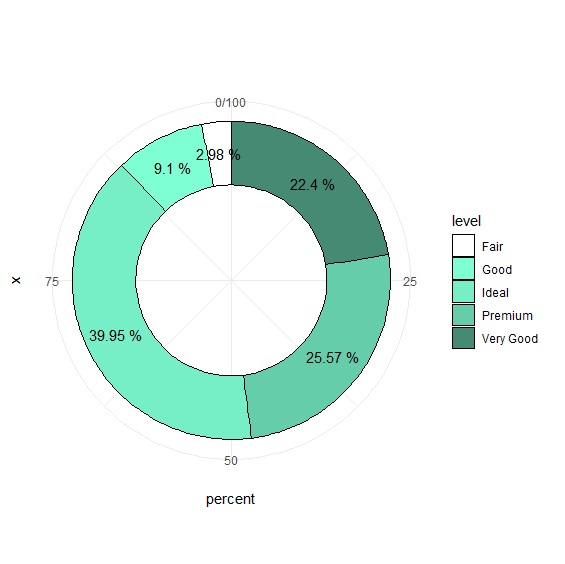
甜甜圈與玫瑰圖
甜甜圈是圓餅圖的改良版,gglopt2只要多加一行expand_limits(x=c(-1,1)),將圖形限制-1到1之間創造出窄化的長條圖,再將長條圖畫在極座標上就可以達到甜甜圈的效果。
     > p<-ggplot(data, aes(x="", y=percent, fill=level))+

     + geom_bar(stat="identity", width=1, color="black")+

     + expand_limits(x=c(-1,1))+

     + coord_polar("y", start=0)+

     + scale_fill_manual(values=c("white","aquamarine1","aquamarine2","aquamarine3", "aquamarine4"))

     + geom_text(aes(label=paste(percent, "%")), position=position_stack(vjust= 0.5))+

     + theme_minimal()

     > p
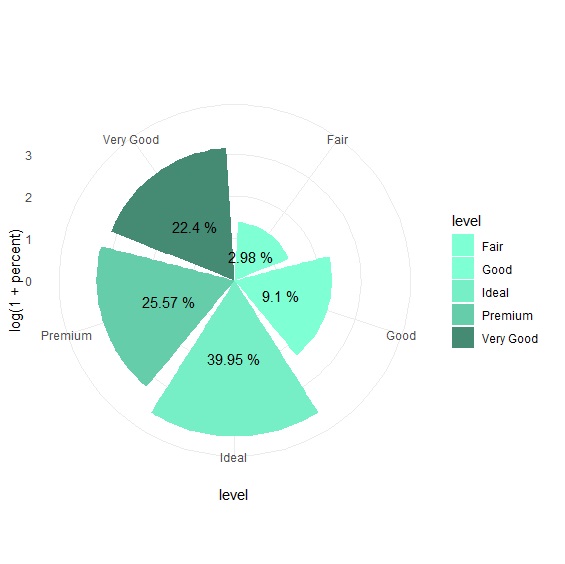
ggplot2玫瑰圖:
     > p<-ggplot(data, aes(x=level, y=log(1+percent), fill=level))+

     + geom_bar(stat="identity")+

     + coord_polar()+

     + scale_fill_manual(values=c("aquamarine","aquamarine1","aquamarine2","aquamarine3", "aquamarine4"))+

     + geom_text(aes(label=paste(percent, "%")), position=position_stack(vjust= 0.5))+

     + theme_minimal()

     > p