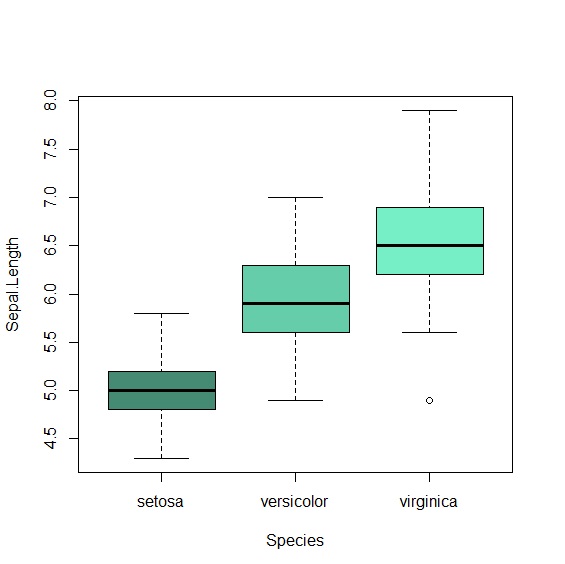
箱型圖又稱為盒鬚圖,它將一組數據的最大值、最小值、中位數及上下四分位數一目瞭然呈現出來,總結變數的分布情形,是一個非常好判斷集中離散趨勢的圖形。
箱型圖
boxplot()是R Base繪製箱型圖的指令。這裡一樣以鳶尾花資料檔示範如何在R畫出箱型圖。
     > data(iris)

     > attach(iris)

     > boxplot(Sepal.Length~Species, col=c("aquamarine4","aquamarine3","aquamarine2"))
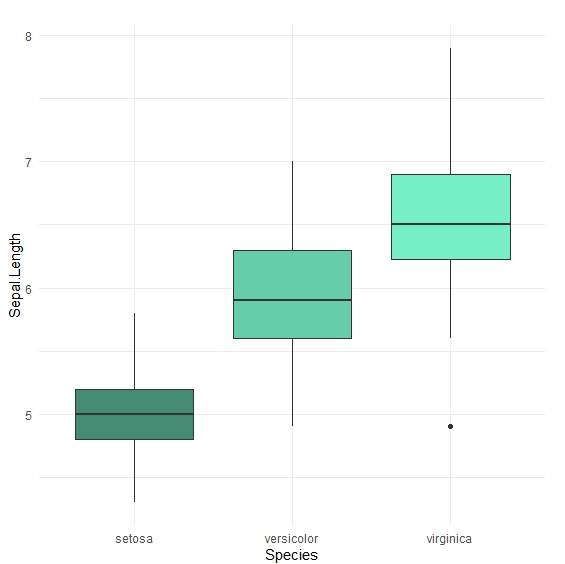
不需多餘設定,ggplot2的geom_boxplot()可以快速畫出箱型圖。
     > p<-ggplot(iris, aes(x=Species, y=Sepal.Length, fill=Species))+

     + geom_boxplot()+

     + scale_fill_manual(values=c("aquamarine4","aquamarine3","aquamarine2"))+

     + theme_minimal()+

     + theme(legend.position="none")

     > p
資料箱型圖
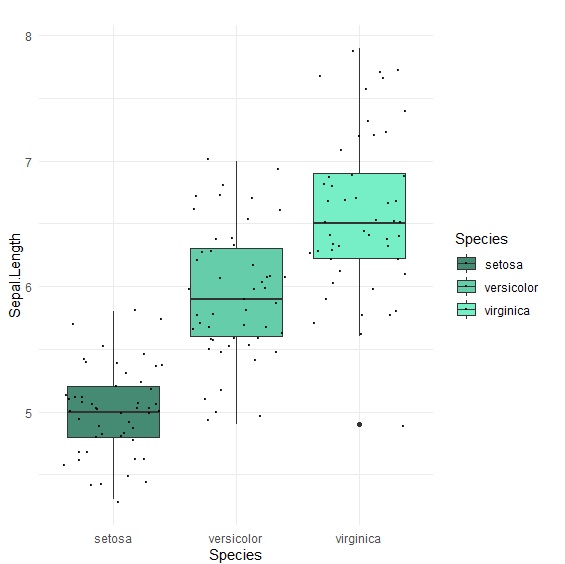
ggplot2有個不錯的功能,可以替箱型圖加上真實資料分布位置,讓我們直接用肉眼看到資料分布,避免箱型圖隱藏資料訊息。要使用這個功能也非常簡單,只要在原本的箱型圖上加上geom_jitter()圖層就可以了。geom_jitter()其實就是geom_point(position="jitter")的快捷方法。
     > p<-ggplot(iris, aes(x=Species, y=Sepal.Length, fill=Species))+

     + geom_boxplot()+

     + scale_fill_manual(values=c("aquamarine4","aquamarine3","aquamarine2"))+

     + theme(legend.position="none")+

     + geom_jitter(color="black", size=0.5, alpha=0.8)+

     + theme_minimal()

     > p
群組箱型圖
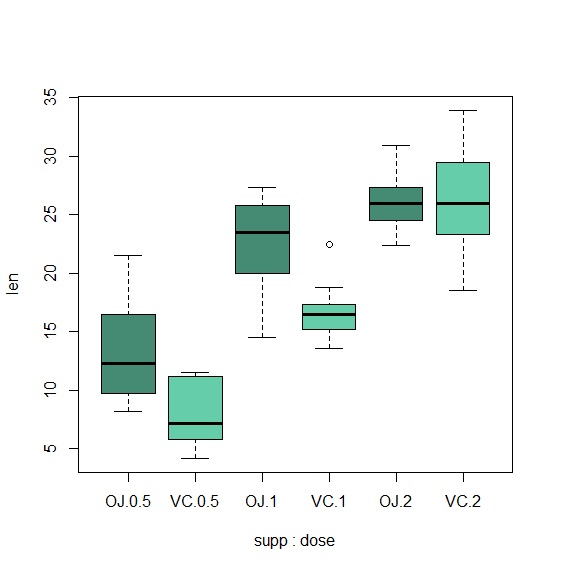
和長條圖一樣,箱型圖也可以比較兩個變數的分布情形,最常用於醫學統計。這裡我們以R資料庫現成的ToothGrowth資料檔,來介紹群組箱型圖。在R Base中只要用「*」符號將變數相連,就能達到群組效果。
     > attach(ToothGrowth)

     > boxplot(len~supp*dose, col=c("aquamarine4","aquamarine3"))+
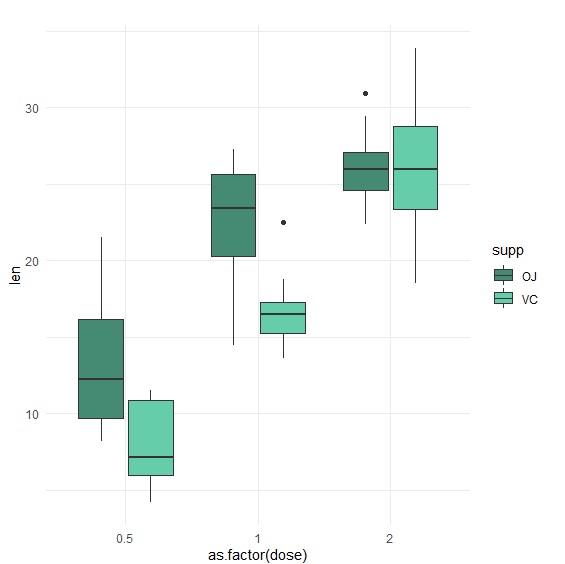
ggplot2群組箱型圖,其實只要將第二個組別設定在fill=variable填色裡即可。
     > p<-ggplot(ToothGrowth, aes(x=as.factor(dose), y=len, fill=supp))+

     + geom_boxplot()+

     + scale_fill_manual(values=c("aquamarine4","aquamarine3"))+

     + theme_minimal()

     > p
小提琴圖
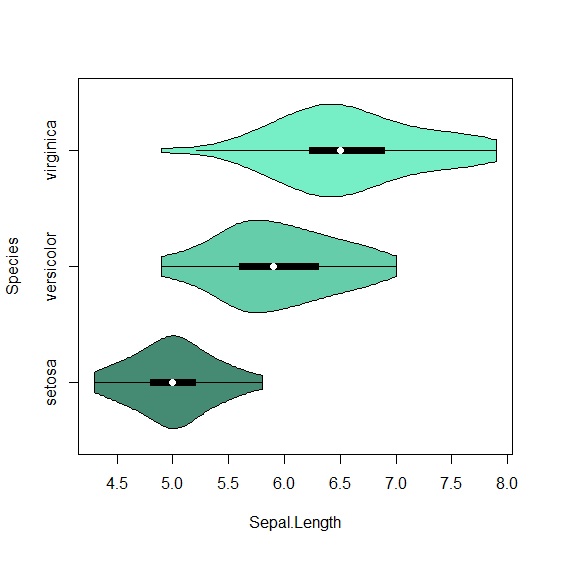
另一種圖結合了箱型圖與密度圖的優點,可以視覺化資料的分布,因為長得像小提琴(violin)因而得名。R Base裡需要額外下載vioplot套件。
     > library(vioplot)

     > vioplot(Sepal.Length~Species, data=iris, horizontal=T, col=c("aquamarine4","aquamarine3","aquamarine2"))
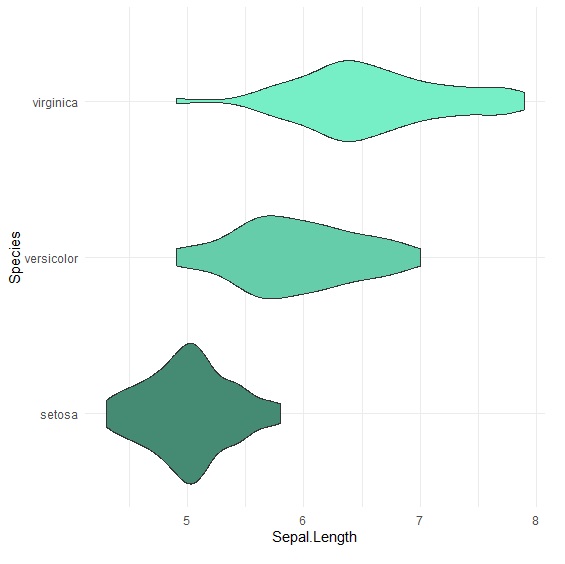
一般情況,小提琴圖非常適合大型資料集,用於比較多筆資料的時候,所以習慣上我們會將小提琴圖翻轉。ggplot2有geom_violin可以畫出小提琴圖。
     > p<-ggplot(iris, aes(x=Species, y=Sepal.Length, fill=Species))+

     + geom_violin()+

     + scale_fill_manual(values=c("aquamarine4","aquamarine3","aquamarine2"))+

     + coord_flip()+

     + theme_minimal()+

     + theme(legend.position="none")

     > p